
Harvest Calendar Generator
Generates a customized visualization of when specific crops will be available for a given farm, downloadable as an SVG.
Technologies used:
- React
- SVG
- CSS Grid Layout
Features
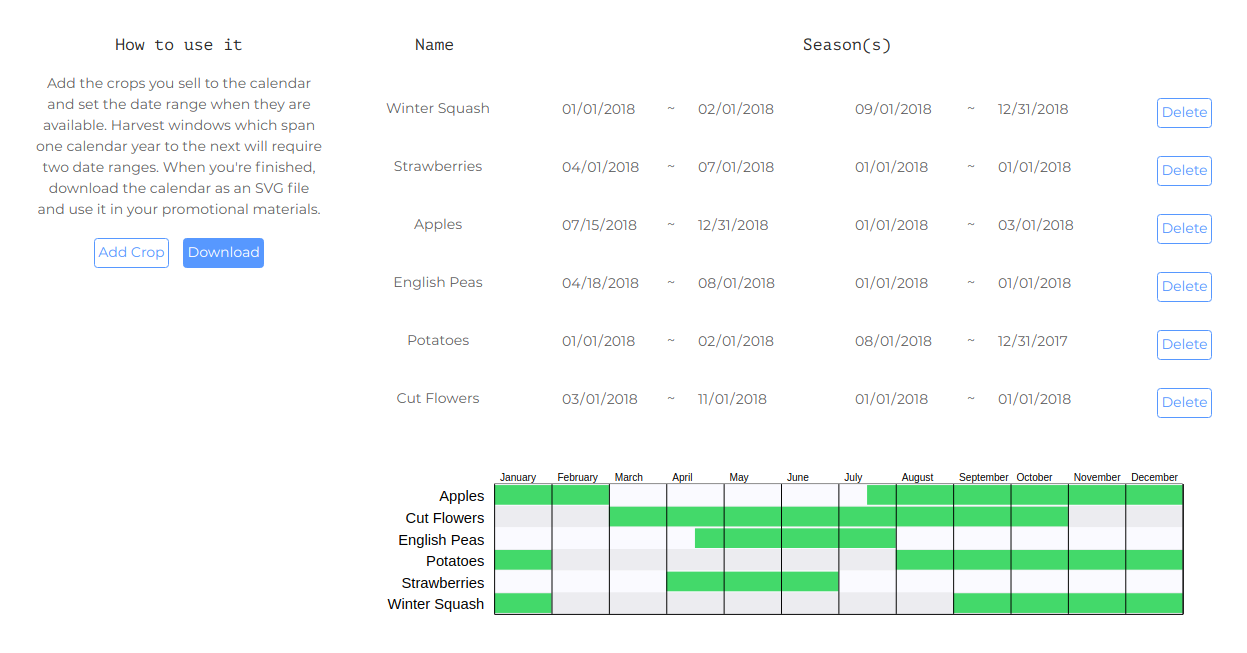
For small farms and local farmers markets, a harvest calendar can be an effective marketing visualization. It shows customers when their favorite fruits and vegetables will be in season, or it can simply be used to browse what is currently available. However, for highly diversified farms and markets, with specialized growing practices and storage techniques, the harvest window and season of availability can vary tremendously between farmers, and vary year to year based on changes to one's crop plan. Those differences can be precisely what give those farms their competitive edge, and so those differences should be reflected in marketing materials.
To create a harvest calendar, the user simply enters in the date ranges when each crop is available, and adds more crops as necessary. The generator then updates the calendar, represented as a bar chart, in live time. When the user is done, the calendar can be downloaded in SVG format and used for marketing purposes in online and print materials.
I started this project while I was working for Norwich Meadows Farm, as a script to automatically update their website's harvest calendar. It could only be customized by modifying a specially formatted CSV file, which was imported by the script. While that method worked for one farm, it was cumbersome to update, and I wanted to create a more generic solution which would be accessible to other farmers and market organizers.
Development Notes
The original version of this project was written in D3. It was a pretty simple adaptation of Mike Bostock's "Let's Make a Bar Chart" tutorial, which was well suited to the task. D3's built-in tool for importing and parsing CSV was also pretty handy, while that was my only data source.
However, as I tried to add multiple user inputs that could all change repeatedly over time, I struggled to adapt the original D3 codebase for the purpose. I found that the D3 syntax, which is very declarative when working with a relatively static dataset, became less intuitive when trying to compensate for a constantly changing dataset. The enter/update/exit pattern especially seemed ill-equipped to deal with deep changes to nested properties, and the addition and deletion of whole nodes at will. The order in which each method was called and how its output was assigned became more critical, giving the whole structure a much more imperative feel.
Eventually I decided to scrap the original codebase and start fresh, using pure React to handle the data and render the SVG. To my surprise, that rendering was incredibly easy to replicate; it only took about one evening's worth of work. The SVG markup could be represented as a functional, stateless component, which receives a single prop: an array of objects representing the individual crops, passed down from the main component which handled all the inputs from the form. This meant I didn't really lose much of D3's declarative nature.
To compare some of the original D3:
crop.append("rect")
  .attr("class", "bar season-one")
  .attr("x", function(d) {
    return x(d.startFirst);
  })
  .attr("width", function(d) {
    return x(d.endFirst - d.startFirst);
  })
  .attr("height", barHeight)
  .attr("fill", barFill);
In React, after mapping over the array of crops, I could represent the same thing in JSX quite easily:
<rect
  className="bar season-one"
  fill={barFill}
  height={barHeight}
  width={
    calcBarWidth(
      crop.seasons[0].start,
      crop.seasons[0].end,
    )}
  x={calcBarStart(crop.seasons[0].start)}
  y={barPadding}
/>
The React code does require the use of some helper functions, but they're fairly straight-forward too:
const calcBarWidth = (start, end) => {
  if (!start || !end) {
    return 0;
  }
  return (calcDate(end) - calcDate(start)) * gridUnit;
}

const calcBarStart = (date) => {
  return calcDate(date) * gridUnit;
}
The calcDate() function and gridUnit constant were required in the original D3 code as well, so the two versions are just about on par there. However, in the D3 version, there was also another helper function, x(), which was easy to miss, but played a vital role:
var x = d3.scaleTime()
  .domain([new Date(2012, 0, 1), new Date(2012, 11, 31)])
  .range([0, width]);
Essentially, D3's API is doing a lot of the heavy-lifting of scaling the time ranges to fit the scale of the chart, similar to what calcBarWidth() and calcBarStart() are doing in the React code. While the version I wrote in React may be a little more verbose, I personally find it much more intelligible, since the meaning isn't being obscured by D3's API's.
I recognize that there are more data utilities in D3 that, with further time and exploration, could have made the D3 implementation a lot less painful. But React was equally up to the task, and I'm quite pleased with the result. Especially, I like how cleanly React represents what is essentially the same XML/SVG that will be rendered to the page in the end. In the future, I'll still consider D3 for handling static datasets. I may even use the CSV portion of the D3 library in this project, if I decide to reintroduce that capability. It is nice though to know that React can work so smoothly with SVG, while handling more dynamic datasets that would be unwieldy in D3.